In the post about memory leaks, two
jcmd histograms showed which class grows. But not what keeps
it alive. For that, you need a heap dump: a picture of the whole heap,
with the objects and the links between them.
We take the same leak again:
UnboundedCache.java,
a static HashMap cache that gets a new key on each request. We analyze
it with Eclipse Memory Analyzer (MAT), an open source tool that Oracle’s
guide names for heap dump analysis. All the commands are in the
heap-dump
folder of the java-gc-lab repository.
Step 1: take the heap dump
javac -d out leaks/UnboundedCache.java
java -Xmx256m -cp out UnboundedCache
jcmd <pid> GC.heap_dump /tmp/cache.hprof
After 20 seconds, the file is 22 MB. On a real application, it can be
several GB: -gz=1 writes it gzipped. You can also let the JVM write it
at the first OutOfMemoryError, with -XX:+HeapDumpOnOutOfMemoryError
(see the post about OutOfMemoryError).
Two warnings:
- The dump holds the values of the objects. MAT even shows the text
of
Stringobjects. On a real application, it can hold passwords or personal data: do not share it, and delete it after use. - Compile before you run. With
java UnboundedCache.java(nojavac), the class is loaded in memory by the source launcher, and MAT points to themainthread instead of the class that leaks. Run with-cp, like a normal application, the class is the one MAT points to.
Step 2: Leak Suspects
The “Leak Suspects” report is the first one to open. MAT lists the objects that keep the most memory alive:
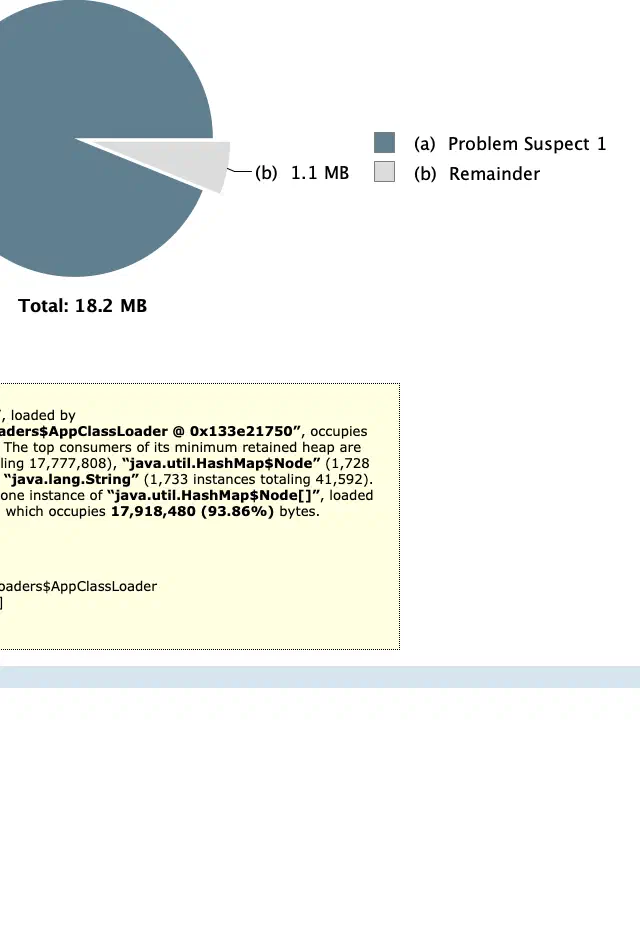
What to read: the class UnboundedCache keeps 93.87% of the heap,
and the memory piles up in one single array,
java.util.HashMap$Node[]: the internal array of a HashMap. The
culprit is found at the first try.
Step 3: shallow heap and retained heap
MAT shows two sizes for each object:
- the shallow heap: the memory of the object itself;
- the retained heap: the memory that the GC would free if this object were freed, that is everything it keeps alive.
For a leak, the retained heap is what matters. The class
UnboundedCache is the best example: its shallow heap is 8 bytes, its
retained heap 17.9 MB.
Step 4: the dominator tree
For MAT, an object x dominates an object y if every path from a GC root to y goes through x. The dominator tree sorts the objects with this rule, from the biggest retained heap to the smallest:
Class Name                                    Shallow Heap   Retained Heap   Percentage
class UnboundedCache @ 0x124213cd0                       8      17,919,200       93.87%
java.lang.Object[2708] @ 0x133e00000 JNI Global     10,848         105,528        0.55%
java.lang.Object[8187] @ 0x133e71f40 JNI Global     32,768          48,424        0.25%
The first line crushes all the others: this is where to dig.
Step 5: the path to GC roots
What is left is why a Report object stays alive. “Path to GC
Roots” goes up from the object to a GC root, that is an object
reachable from outside the heap, such as a loaded class (“System
Class”). We exclude weak and soft references: they do not stop the GC
from freeing an object.
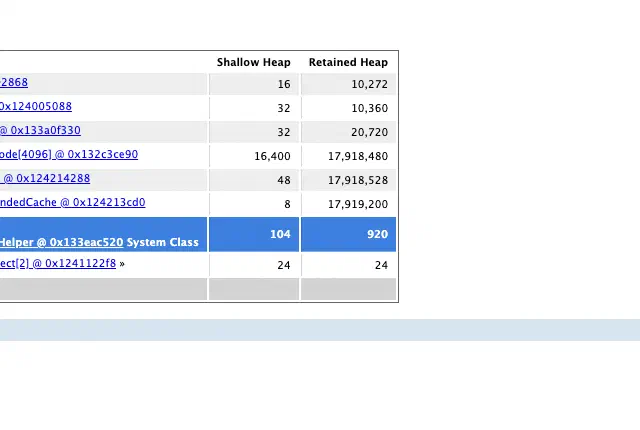
Read the path from the bottom up: the root keeps the class
UnboundedCache, its static field CACHE keeps the HashMap, which
keeps its array, which keeps each Report. It is exactly the chain of
the diagram in
the post about memory leaks, but
this time found in a real dump.
The fix, and the heap curve
The fix: give the cache a maximum size. In
BoundedCache.java,
a LinkedHashMap removes the oldest entry above 500 with
removeEldestEntry. The heap after each GC goes up while the cache
fills, then does not move anymore:
java -Xmx256m -Xlog:gc heap-dump/BoundedCache.java
[0.348s][info][gc] GC(0) Pause Young (Normal) (G1 Evacuation Pause) 48M->3M(256M) 1.559ms
[16.656s][info][gc] GC(19) Pause Young (Normal) (G1 Evacuation Pause) 156M->9M(256M) 0.828ms
[35.667s][info][gc] GC(41) Pause Young (Normal) (G1 Evacuation Pause) 156M->9M(256M) 0.984ms
How to read these lines is explained in the post about GC logs.
MAT without a window
MAT also has a batch mode, useful on a server with no screen: it analyzes the dump and writes the reports as HTML. The screenshots of this post come from this mode:
ParseHeapDump.sh /tmp/cache.hprof org.eclipse.mat.api:suspects
ParseHeapDump.sh /tmp/cache.hprof -command=dominator_tree org.eclipse.mat.api:query
The first one writes cache_Leak_Suspects.zip, the second one
cache_Query.zip. The full commands, with the path to GC roots, are in
the README of the heap-dump folder. Remember to delete the dump and the
index files that MAT writes next to it.
Tested with Java 25 (Temurin 25.0.4) and Eclipse MAT 1.17, on macOS; the fix also with Java 11, 17 and 21.
Sources: the Eclipse MAT help
(Shallow vs. Retained Heap,
Dominator Tree,
Garbage Collection Roots,
Batch mode),
Oracle’s troubleshooting guide on memory leaks
and the documentation of jcmd
(JDK 25).