In this series, we have already used about six tools: GC logs, jstat,
several jcmd commands, Eclipse MAT. Each one answers a clear question,
and each one has a cost. This post puts them in order. Then it shows
JFR, the most complete tool of the JDK, on an example: find the method
that creates millions of objects.
Which tool for which question
| Question | Tool | Command | Cost |
|---|---|---|---|
| Does the GC make long pauses? Does the heap after GC go up? | GC logs | -Xlog:gc*:file=gc.log | keep it on in production |
| Which area fills up, live? | jstat | jstat -gcutil <pid> 1s | not given; its doc says “experimental and unsupported” |
| How much heap is used? | jcmd | jcmd <pid> GC.heap_info | medium |
| Which class grows? | jcmd | jcmd <pid> GC.class_histogram | high: runs a full GC |
| What keeps the objects alive? | heap dump + Eclipse MAT | jcmd <pid> GC.heap_dump | high: a big file |
| Does the Metaspace grow? | jcmd | jcmd <pid> VM.metaspace | medium |
| What does native memory do? | jcmd + NMT | -XX:NativeMemoryTracking=summary, then jcmd <pid> VM.native_memory | medium |
| What do the threads do? | jcmd | jcmd <pid> Thread.print | medium |
| Which method allocates, where are the pauses, over time? | JFR | -XX:StartFlightRecording, then jfr view | low with the default configuration |
The “medium” or “high” cost of the jcmd commands is the one given
in their documentation. Each of these tools was already used in a post:
GC logs,
OutOfMemoryError,
memory leaks and
the heap dump with Eclipse MAT.
JFR step by step
Java Flight Recorder (JFR) is part of the JDK. It records events from the JVM and from the application: GC, allocations, threads, the most used methods…
Record. At startup:
java -XX:StartFlightRecording:filename=hot.jfr,settings=profile -jar app.jar
Or on an application that already runs: jcmd <pid> JFR.start, then
jcmd <pid> JFR.dump filename=hot.jfr to write the recording.
Choose the configuration. Oracle’s documentation recommends the
default configuration for continuous recordings, with usually less
than 1% overhead. The profile configuration records more events, such
as allocation samples: use it to analyze a problem. The doc gives no
number for its overhead.
Read. The jfr command of the JDK shows tables, with no graphical
interface:
jfr view allocation-by-site hot.jfr
jfr view gc hot.jfr
Before Java 21:
jfr viewdoes not exist. On Java 17, the command answersjfr: unknown command 'view': usejfr printor JDK Mission Control.
Example: the method that creates millions of objects
HotAllocation.java
builds 10 million labels with String.format. We record it with JFR,
then:
jfr view allocation-by-site hot.jfr

Method                                              Allocation Pressure
--------------------------------------------------- -------------------
java.util.Formatter.parse(String)                                24.70%
java.lang.Long.toString(long)                                    18.83%
java.lang.AbstractStringBuilder.<init>(int)                      14.20%
java.util.Arrays.copyOfRange(byte[], int, int)                   10.61%
java.util.ArrayList.grow(int)                                    10.35%
Formatter.parse creates the most objects. These are samples: the
percentages change a little from one run to the next, but the top of
the table stays the same. Now we need the caller in our code: the stack
of one sample gives it.
jfr print --events jdk.ObjectAllocationSample --stack-depth 6 hot.jfr

  stackTrace = [
    java.util.Formatter.parse(String) line: 2810
    java.util.Formatter.format(Locale, String, Object[]) line: 2744
    java.util.Formatter.format(String, Object[]) line: 2698
    java.lang.String.format(String, Object[]) line: 4455
    HotAllocation.label(int) line: 16
    HotAllocation.main(String[]) line: 24
The cause: String.format, called in label(). Each call parses the
pattern "order-%08d" and creates several objects. In
FixedAllocation.java,
the same labels are built with a StringBuilder. Same result, with
-Xmx256m and JFR on:
HotAllocation | FixedAllocation | |
|---|---|---|
| Java 25 | 32 GCs, 2.7 s | 9 GCs, 0.7 s |
| Java 21 | 44 GCs | 12 GCs |
| Java 17 | 94 GCs | 10 GCs |
Fewer objects created, so fewer GCs: this is the “allocation rate” of the post about GC logs.
jcmd, the Swiss Army knife
jcmd sends a command to a running JVM. jcmd <pid> help lists all
the commands you can use. The ones of this series: GC.heap_info,
GC.class_histogram, GC.heap_dump, GC.run, VM.metaspace,
VM.native_memory, Thread.print, and JFR.start / JFR.dump. Its
documentation gives the impact of each one: read it before you run a
“High” command on a busy production system.
VisualVM and JDK Mission Control
If you prefer a window:
- VisualVM follows a JVM live (CPU, GC activity, heap, Metaspace), shows its threads, takes and opens heap dumps, and does simple profiling.
- JDK Mission Control
opens
.jfrfiles and shows the same data asjfr view, as charts.
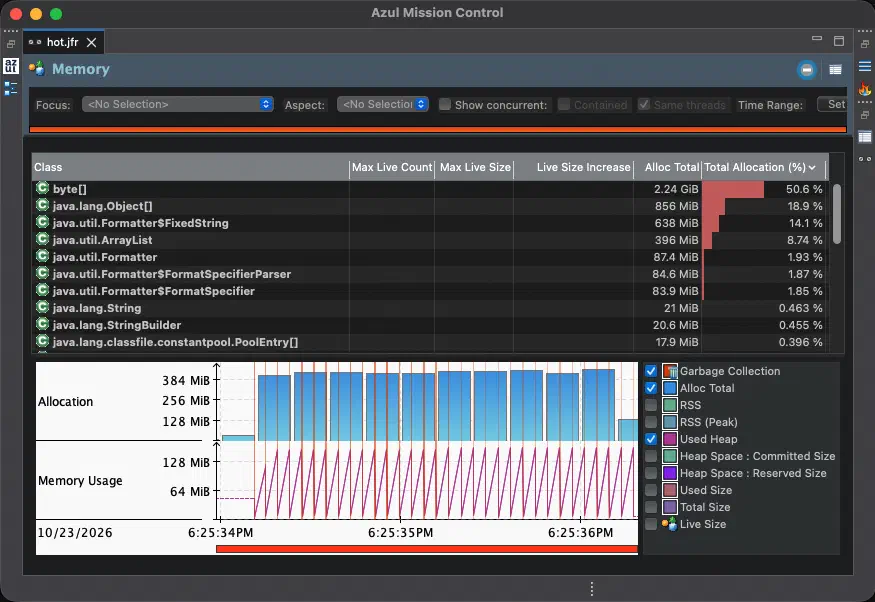
The same hot.jfr, opened in JMC. JMC counts allocations by class,
jfr view allocation-by-site by method: both views come from the same
recording.
Before Java 9: VisualVM came with the JDK (
jvisualvm). It was removed in Java 9, and you now download it on its own.
You install both separately. The commands of this post are already in the JDK, and they work on a server with no screen.
In production
- Keep on all the time: GC logs in a file, and JFR with the
defaultconfiguration. - Now and then, when you know the cost:
GC.class_histogram(a full GC),GC.heap_dump(a big file, with sensitive data), JFR withprofile. - Before you act: read again the “Impact” line of the command in
the
jcmddocumentation.
Tested with Java 17, 21 and 25 (Temurin 17.0.20, 21.0.12, 25.0.4), on macOS; the programs compile with Java 8.
Sources: the documentation of
jcmd,
jfr
and jstat,
the Flight Recorder guide on its configurations
(JDK 25), JDK-8306703
(jfr view) and JDK-8180002
(VisualVM removed from the JDK).