One service receives the readings of sensors; another one must process and store them. If the first one calls the second one over REST, the two are tied: when the second one is stopped or slow, the first one cannot deliver anything. Kafka sits between them: the first one publishes a message, the second one reads it at its own pace.
This post builds that link from end to end, locally: Kafka in KRaft
mode in Docker, a Spring Boot service that publishes a plain line of
text, another one that reads it, and a page that shows the partition and
the offset of each message. All the code is in the tag
phase-1
of the public repository iot-monitoring-platform.
The project in one diagram
- iot-backend-ingestion (port 8081) receives a line of text, for
example
sensor-1 TEMPERATURE 21.5, and publishes it to the topiciot-sensor-events. - iot-backend-processing (port 8082) reads the topic, stores each message in PostgreSQL and gives it through a REST API.
- A simulator sends one line per second, and an Angular page shows the last messages.
The message is a plain String, with no key, on a topic with only one
partition. This is on purpose: the goal is to see the full path of a
message, with as few settings as possible. This post is only about the
Kafka part; the business rule and the way the code is organized
(hexagonal architecture) are the topic of another post.
At the end, you have Kafka and PostgreSQL in Docker, the two services on your machine, and messages whose partition and offset you can follow, from the send to the database.
Kafka in KRaft mode with the official image
Since Kafka 4.0, Kafka runs fully without ZooKeeper: in KRaft mode, controller nodes of Kafka manage the metadata of the cluster. On a dev machine, one node can be both broker and controller, so one container is enough.
The project uses the official image of the Apache Kafka project,
apache/kafka. With its default config, it starts one node, which is
both broker and controller, and listens on port 9092. The compose.yaml
file of the project (excerpt):
services:
  kafka:
    # Official Apache Kafka image. With its default config it starts one
    # node in KRaft mode (no ZooKeeper) and listens on localhost:9092.
    image: apache/kafka:4.4.0
    container_name: iot-kafka
    ports:
      - "9092:9092"
No environment variable: no KAFKA_ZOOKEEPER_CONNECT, no list of
listeners to write. The same file also starts PostgreSQL.
docker compose up -d
The logs of the container show what the default config does
(docker logs iot-kafka, excerpt):
	advertised.listeners = [PLAINTEXT://localhost:9092]
	node.id = 1
	process.roles = [broker, controller]
process.roles = [broker, controller]: one node has both roles.
advertised.listeners is the address that Kafka gives to the clients:
localhost:9092. The Spring Boot services run on the machine, so this
address works for them as it is.
Publish a String
The config
The application.yml file of the ingestion service:
spring:
  application:
    name: iot-backend-ingestion
  kafka:
    # Spring Boot uses String serializers by default: the message is a plain String.
    bootstrap-servers: localhost:9092

iot:
  kafka:
    topic: iot-sensor-events
There is no Kafka config class in the project. Spring Boot creates a
KafkaTemplate, and its default serializers are StringSerializer, for
the key and for the value. So there is nothing to set to publish text.
bootstrap-servers is already localhost:9092 by default; I write it
anyway, so you can see where the service connects.
The send
The adapter that publishes (excerpt of KafkaSensorMessagePublisher):
@Override
public void publish(SensorMessage message) {
    // No key: in phase 1 the topic has one partition, so the order is
    // kept anyway. The key comes in phase 2, with several partitions.
    kafkaTemplate.send(topic, message.text())
            .whenComplete((result, exception) -> {
                // The send is asynchronous: an error only shows in the log.
                // Error handling (retry, DLT) comes in phase 2.
                if (exception != null) {
                    LOGGER.error("Could not publish the message '{}' to {}", message.text(), topic, exception);
                } else {
                    LOGGER.info("Published '{}' to {} (partition {}, offset {})", message.text(), topic,
                            result.getRecordMetadata().partition(), result.getRecordMetadata().offset());
                }
            });
}
send does not block: it returns a CompletableFuture<SendResult>. The
result comes later, with the partition and the offset that Kafka gave to
the message. This is why the REST controller answers 202 Accepted and
not 200 OK: the service handed the message to Kafka, but it does not
wait for the confirmation. The limit is clear: if the send fails, the
error only shows in the log. Error handling comes with phase 2.
The topic
The topic is declared by a NewTopic bean (excerpt of
IngestionConfig):
@Bean
public NewTopic sensorEventsTopic(IotKafkaProperties properties) {
    return TopicBuilder.name(properties.topic())
            .partitions(1)
            .replicas(1)
            .build();
}
At start, Spring creates the topic if it does not exist; if it already exists, the bean is ignored. So the service does not depend on the automatic creation of topics by the broker. One partition and one replica: enough for a single local broker.
docker exec iot-kafka /opt/kafka/bin/kafka-topics.sh --bootstrap-server localhost:9092 --describe --topic iot-sensor-events
Topic: iot-sensor-events	TopicId: oiLmbWoqSneUtet0x7hxCw	PartitionCount: 1	ReplicationFactor: 1	Configs: min.insync.replicas=1,segment.bytes=1073741824
	Topic: iot-sensor-events	Partition: 0	Leader: 1	Replicas: 1	Isr: 1	Elr: 	LastKnownElr:
Consume
The listener
On the processing side, the config adds a consumer group:
spring:
  kafka:
    # Spring Boot uses String deserializers by default: the message is a plain String.
    bootstrap-servers: localhost:9092
    consumer:
      group-id: iot-backend-processing
      # Read the topic from the start when the group has no offset yet,
      # so messages sent before the first start are not lost.
      auto-offset-reset: earliest
And the listener (excerpt of SensorMessageListener):
@KafkaListener(topics = "${iot.kafka.topic}")
@Transactional
public void onMessage(ConsumerRecord<String, String> consumerRecord) {
    ReceivedMessage stored = storeMessage.store(
            consumerRecord.value(), consumerRecord.partition(), consumerRecord.offset());
    // … log of the result
}
The ConsumerRecord gives the value (our text), and also its place in
the topic: the partition and the offset. The service stores them with
the message, so we can see them on the page.
The group iot-backend-processing is the name under which Kafka keeps
where the consumer is: for each partition, a « committed » position,
the offset of the next message to read. When it restarts, the service
goes on from this position.
The trap of auto-offset-reset
What does a consumer do when its group has no saved position yet, for
example at the very first start? This is the job of
auto.offset.reset. Its main values:
| Value | With no saved position, the consumer… |
|---|---|
latest (default) | starts at the end of the topic: it reads only the messages that come after |
earliest | starts at the beginning of the topic: it also reads the messages already there |
none | stops with an error |
The setting matters only in this case. As soon as the group has a position, the consumer goes on from where it was.
To see it, two new groups read the same topic, which already holds two messages. First with the default value:
docker exec iot-kafka /opt/kafka/bin/kafka-console-consumer.sh --bootstrap-server localhost:9092 --topic iot-sensor-events --group demo-latest --timeout-ms 5000
[2026-10-24 16:59:56,249] ERROR Error processing message, terminating consumer process:  (org.apache.kafka.tools.consumer.ConsoleConsumer)
org.apache.kafka.common.errors.TimeoutException
Processed a total of 0 messages
Then with earliest:
docker exec iot-kafka /opt/kafka/bin/kafka-console-consumer.sh --bootstrap-server localhost:9092 --topic iot-sensor-events --group demo-from-start --command-property auto.offset.reset=earliest --timeout-ms 5000
sensor-1 TEMPERATURE 21.5
sensor-3 HUMIDITY 47.2
[2026-10-24 17:01:09,610] ERROR Error processing message, terminating consumer process:  (org.apache.kafka.tools.consumer.ConsoleConsumer)
org.apache.kafka.common.errors.TimeoutException
Processed a total of 2 messages
The TimeoutException is normal: --timeout-ms 5000 stops the tool
after five seconds with no new message. (I removed from these outputs a
line of information about the KIP-848 protocol.)
With latest, the first group read nothing: the two messages were there
before it. This is exactly what would happen to the processing service
if it started after the ingestion with the default value. Hence
auto-offset-reset: earliest in its application.yml.
Run the project and watch Kafka work
Kafka and PostgreSQL are already running (docker compose up -d). In
two terminals, from the root of the project:
cd iot-backend-processing
mvn spring-boot:run
cd iot-backend-ingestion
mvn spring-boot:run
Then one message:
curl -i -X POST -H "Content-Type: text/plain" --data "sensor-1 TEMPERATURE 21.5" http://localhost:8081/api/messages
HTTP/1.1 202
Content-Length: 0
Date: Sat, 24 Oct 2026 16:59:19 GMT
The two services tell the path of the message in their logs (after a second message; I keep only the end of the lines, without the date and the thread name):
Published 'sensor-1 TEMPERATURE 21.5' to iot-sensor-events (partition 0, offset 0)
Published 'sensor-3 HUMIDITY 47.2' to iot-sensor-events (partition 0, offset 1)
Stored 'sensor-1 TEMPERATURE 21.5' (partition 0, offset 0)
Stored 'sensor-3 HUMIDITY 47.2' (partition 0, offset 1)
The producer and the consumer see the same position: partition 0, offsets 0 then 1. In a partition, the offset is simply the rank of the message, and it only grows.
The tool kafka-consumer-groups.sh shows where the group of the
processing service is (short output: without the columns CONSUMER-ID,
HOST and CLIENT-ID):
docker exec iot-kafka /opt/kafka/bin/kafka-consumer-groups.sh --bootstrap-server localhost:9092 --describe --group iot-backend-processing
GROUP                  TOPIC             PARTITION  CURRENT-OFFSET  LOG-END-OFFSET  LAG
iot-backend-processing iot-sensor-events 0          2               2               0
CURRENT-OFFSET is the committed position of the group (the next
message to read), LOG-END-OFFSET the end of the partition, and LAG
the gap between the two: 0, the service is up to date.
To send a steady flow, the project has a simulator (one line per second):
cd iot-event-simulator
mvn compile exec:java
The Angular page (npm start in iot-frontend-angular, then
http://localhost:4200) then shows the messages with their partition and
their offset, which grows with each line.
See the topic with Kafdrop
kafka-console-consumer.sh is the basic tool. To see the topic in a
browser, Kafdrop is a web
UI for Kafka (Apache 2.0 license, Java 17 or newer). It is not part of
the project: I run it next to it, with its official jar (release
4.3.0), without changing the project:
java --add-opens=java.base/sun.nio.ch=ALL-UNNAMED \
  -jar kafdrop-4.3.0.jar --kafka.brokerConnect=localhost:9092
Then http://localhost:9000, the topic iot-sensor-events, and its
messages:
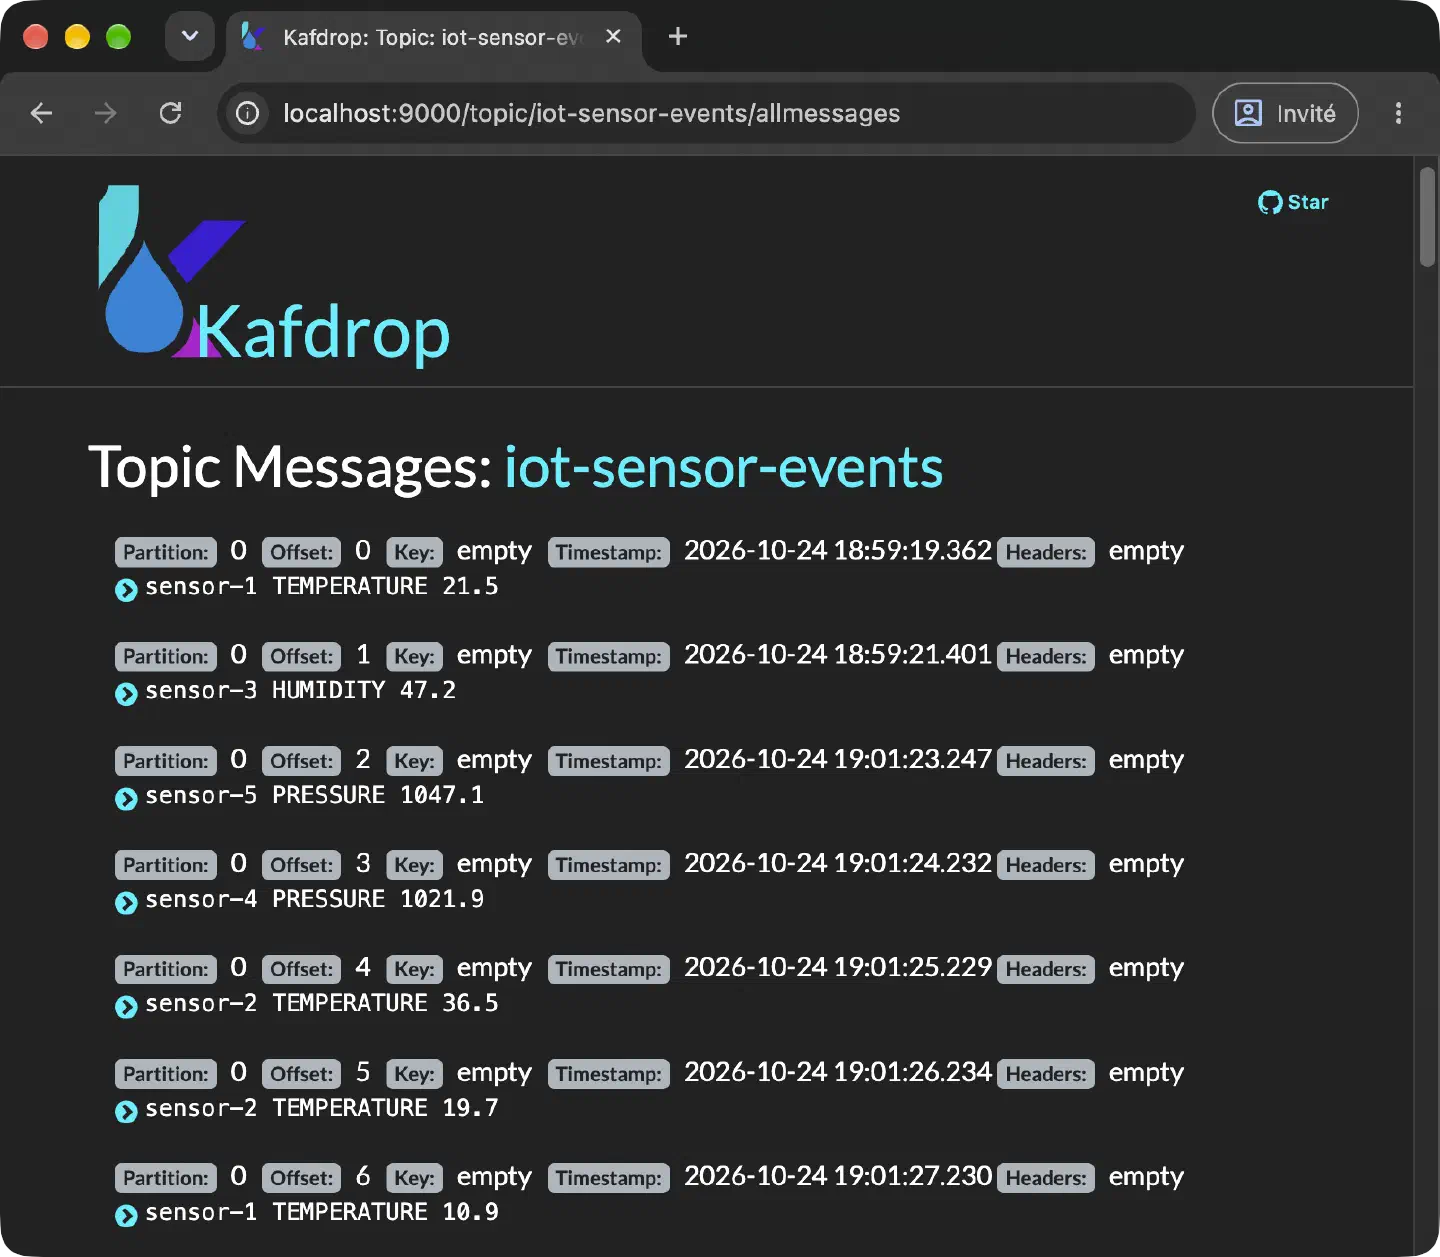
We find everything from above: one partition, offsets that follow each
other, and Key: empty on each message, because the service publishes
with no key.
Kafdrop runs on the machine and not in a container, for a reason seen
above: Kafka advertises localhost:9092. From another container, this
address means the container itself, and the connection fails. It would
need a second listener in compose.yaml; that is for phase 2.
What is missing, on purpose
This project is minimal on purpose. It lacks what a real system would have:
- a message key: with no key and one partition, the order is kept; with several partitions, a key (the sensor) will be needed to keep the order of the messages of one sensor;
- several partitions and several consumers, to process in parallel;
- error handling: today, a failed send leaves only a log line, and a message that cannot be stored is retried with the default settings of Spring Kafka, then lost;
- a typed event with a contract, instead of a line of text.
This is the plan of phase 2 of the project, with its own posts.
Tested with
Java 25 (Temurin 25.0.4), Spring Boot 4.1.2, Apache Kafka 4.4.0 (image
apache/kafka:4.4.0), PostgreSQL 18.6, Maven 3.10.0, Docker Desktop on
macOS, Kafdrop 4.3.0. Code: tag
phase-1.
Sources
- Apache Kafka 4.0.0 Release Announcement (Kafka without ZooKeeper, KRaft by default)
- Kafka: Getting Started, Docker
(the
apache/kafkaimage and its default config) - Kafka: consumer configs,
auto.offset.reset - Spring Boot: Kafka
(the auto-configured
KafkaTemplate, theNewTopicbeans) - Spring for Apache Kafka: Sending Messages
(
sendreturns aCompletableFuture) - Spring for Apache Kafka: Configuring Topics
- Kafdrop (README, license)
Further reading
- The README of the tag
phase-1: the whole project, the Angular page and its dev proxy. - The next post of the series: Hexagonal architecture with Spring Boot: a simple example, how the code of the processing service is organized.